Create hierarchical edge bundles between node connections
Source:R/geom_conn_bundle.R
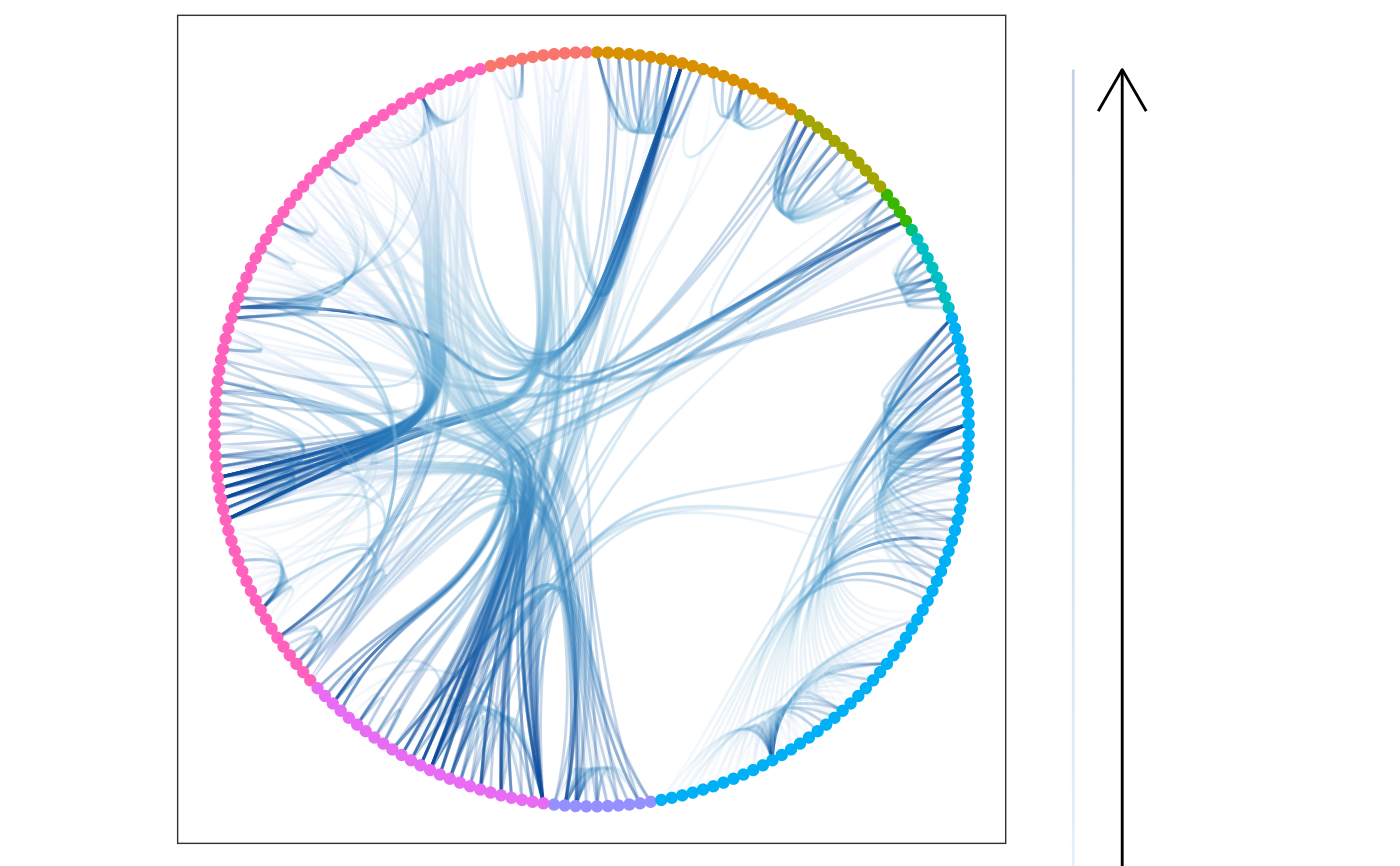
geom_conn_bundle.RdHierarchical edge bundling is a technique to introduce some order into the hairball structure that can appear when there's a lot of overplotting and edge crossing in a network plot. The concept requires that the network has an intrinsic hierarchical structure that defines the layout but is not shown. Connections between points (that is, not edges) are then drawn so that they loosely follows the underlying hierarchical structure. This results in a flow-like structure where lines that partly move in the same direction will be bundled together.
geom_conn_bundle(
  mapping = NULL,
  data = get_con(),
  position = "identity",
  arrow = NULL,
  lineend = "butt",
  show.legend = NA,
  n = 100,
  tension = 0.8,
  ...
)

geom_conn_bundle2(
  mapping = NULL,
  data = get_con(),
  position = "identity",
  arrow = NULL,
  lineend = "butt",
  show.legend = NA,
  n = 100,
  tension = 0.8,
  ...
)

geom_conn_bundle0(
  mapping = NULL,
  data = get_con(),
  position = "identity",
  arrow = NULL,
  lineend = "butt",
  show.legend = NA,
  tension = 0.8,
  ...
)
Arguments
- mapping
Set of aesthetic mappings created by
ggplot2::aes()orggplot2::aes_(). By default x, y, xend, yend, group and circular are mapped to x, y, xend, yend, edge.id and circular in the edge data.- data
The result of a call to
get_con()- position
A position adjustment to use on the data for this layer. This can be used in various ways, including to prevent overplotting and improving the display. The
positionargument accepts the following:The result of calling a position function, such as
position_jitter(). This method allows for passing extra arguments to the position.A string naming the position adjustment. To give the position as a string, strip the function name of the
position_prefix. For example, to useposition_jitter(), give the position as"jitter".For more information and other ways to specify the position, see the layer position documentation.
- arrow
Arrow specification, as created by
grid::arrow().- lineend
Line end style (round, butt, square).
- show.legend
logical. Should this layer be included in the legends?
NA, the default, includes if any aesthetics are mapped.FALSEnever includes, andTRUEalways includes. It can also be a named logical vector to finely select the aesthetics to display. To include legend keys for all levels, even when no data exists, useTRUE. IfNA, all levels are shown in legend, but unobserved levels are omitted.- n
The number of points to create along the path.
- tension
How "loose" should the bundles be. 1 will give very tight bundles, while 0 will turn of bundling completely and give straight lines. Defaults to 0.8
- ...
Other arguments passed on to
layer()'sparamsargument. These arguments broadly fall into one of 4 categories below. Notably, further arguments to thepositionargument, or aesthetics that are required can not be passed through.... Unknown arguments that are not part of the 4 categories below are ignored.Static aesthetics that are not mapped to a scale, but are at a fixed value and apply to the layer as a whole. For example,
colour = "red"orlinewidth = 3. The geom's documentation has an Aesthetics section that lists the available options. The 'required' aesthetics cannot be passed on to theparams. Please note that while passing unmapped aesthetics as vectors is technically possible, the order and required length is not guaranteed to be parallel to the input data.When constructing a layer using a
stat_*()function, the...argument can be used to pass on parameters to thegeompart of the layer. An example of this isstat_density(geom = "area", outline.type = "both"). The geom's documentation lists which parameters it can accept.Inversely, when constructing a layer using a
geom_*()function, the...argument can be used to pass on parameters to thestatpart of the layer. An example of this isgeom_area(stat = "density", adjust = 0.5). The stat's documentation lists which parameters it can accept.The
key_glyphargument oflayer()may also be passed on through.... This can be one of the functions described as key glyphs, to change the display of the layer in the legend.
Note
In order to avoid excessive typing edge aesthetic names are
automatically expanded. Because of this it is not necessary to write
edge_colour within the aes() call as colour will
automatically be renamed appropriately.
Aesthetics
geom_conn_bundle* understands the following aesthetics. Bold aesthetics are automatically set, but can be overwritten.
x
y
group
circular
edge_colour
edge_width
edge_linetype
edge_alpha
filter
Computed variables
- index
The position along the path (not computed for the *0 version)
References
Holten, D. (2006). Hierarchical edge bundles: visualization of adjacency relations in hierarchical data. IEEE Transactions on Visualization and Computer Graphics, 12(5), 741-748. doi:10.1109/TVCG.2006.147
Examples
# Create a graph of the flare class system
library(tidygraph)
flareGraph <- tbl_graph(flare$vertices, flare$edges) %>%
  mutate(
    class = map_bfs_chr(node_is_root(), .f = function(node, dist, path, ...) {
      if (dist <= 1) {
        return(shortName[node])
      }
      path$result[[nrow(path)]]
    })
  )
importFrom <- match(flare$imports$from, flare$vertices$name)
importTo <- match(flare$imports$to, flare$vertices$name)

# Use class inheritance for layout but plot class imports as bundles
ggraph(flareGraph, 'dendrogram', circular = TRUE) +
  geom_conn_bundle(aes(colour = after_stat(index)),
    data = get_con(importFrom, importTo),
    edge_alpha = 0.25
  ) +
  geom_node_point(aes(filter = leaf, colour = class)) +
  scale_edge_colour_distiller('', direction = 1, guide = 'edge_direction') +
  coord_fixed() +
  ggforce::theme_no_axes()