This geom draws edges as glyphs with their x-position defined by the
x-position of the start node, and the y-position defined by the y-position of
the end node. As such it will result in a matrix layout when used in
conjunction with layout_tbl_graph_matrix()
geom_edge_point(
  mapping = NULL,
  data = get_edges(),
  position = "identity",
  mirror = FALSE,
  show.legend = NA,
  ...
)
Arguments
- mapping
Set of aesthetic mappings created by
ggplot2::aes()orggplot2::aes_(). By default x, y, xend, yend, group and circular are mapped to x, y, xend, yend, edge.id and circular in the edge data.- data
The return of a call to
get_edges()or a data.frame giving edges in correct format (see details for for guidance on the format). Seeget_edges()for more details on edge extraction.- position
A position adjustment to use on the data for this layer. This can be used in various ways, including to prevent overplotting and improving the display. The
positionargument accepts the following:The result of calling a position function, such as
position_jitter(). This method allows for passing extra arguments to the position.A string naming the position adjustment. To give the position as a string, strip the function name of the
position_prefix. For example, to useposition_jitter(), give the position as"jitter".For more information and other ways to specify the position, see the layer position documentation.
- mirror
Logical. Should edge points be duplicated on both sides of the diagonal. Intended for undirected graphs. Default to
FALSE- show.legend
logical. Should this layer be included in the legends?
NA, the default, includes if any aesthetics are mapped.FALSEnever includes, andTRUEalways includes. It can also be a named logical vector to finely select the aesthetics to display. To include legend keys for all levels, even when no data exists, useTRUE. IfNA, all levels are shown in legend, but unobserved levels are omitted.- ...
Other arguments passed on to
layer()'sparamsargument. These arguments broadly fall into one of 4 categories below. Notably, further arguments to thepositionargument, or aesthetics that are required can not be passed through.... Unknown arguments that are not part of the 4 categories below are ignored.Static aesthetics that are not mapped to a scale, but are at a fixed value and apply to the layer as a whole. For example,
colour = "red"orlinewidth = 3. The geom's documentation has an Aesthetics section that lists the available options. The 'required' aesthetics cannot be passed on to theparams. Please note that while passing unmapped aesthetics as vectors is technically possible, the order and required length is not guaranteed to be parallel to the input data.When constructing a layer using a
stat_*()function, the...argument can be used to pass on parameters to thegeompart of the layer. An example of this isstat_density(geom = "area", outline.type = "both"). The geom's documentation lists which parameters it can accept.Inversely, when constructing a layer using a
geom_*()function, the...argument can be used to pass on parameters to thestatpart of the layer. An example of this isgeom_area(stat = "density", adjust = 0.5). The stat's documentation lists which parameters it can accept.The
key_glyphargument oflayer()may also be passed on through.... This can be one of the functions described as key glyphs, to change the display of the layer in the legend.
Aesthetics
geom_edge_point understands the following
aesthetics. Bold aesthetics are automatically set, but can be overwritten.
x
y
edge_shape
edge_colour
edge_size
edge_alpha
filter
Edge aesthetic name expansion
In order to avoid excessive typing edge aesthetic names are
automatically expanded. Because of this it is not necessary to write
edge_colour within the aes() call as colour will
automatically be renamed appropriately.
See also
Other geom_edge_*:
geom_edge_arc(),
geom_edge_bend(),
geom_edge_bundle_force(),
geom_edge_bundle_minimal(),
geom_edge_bundle_path(),
geom_edge_density(),
geom_edge_diagonal(),
geom_edge_elbow(),
geom_edge_fan(),
geom_edge_hive(),
geom_edge_link(),
geom_edge_loop(),
geom_edge_parallel(),
geom_edge_sf(),
geom_edge_span(),
geom_edge_tile()
Examples
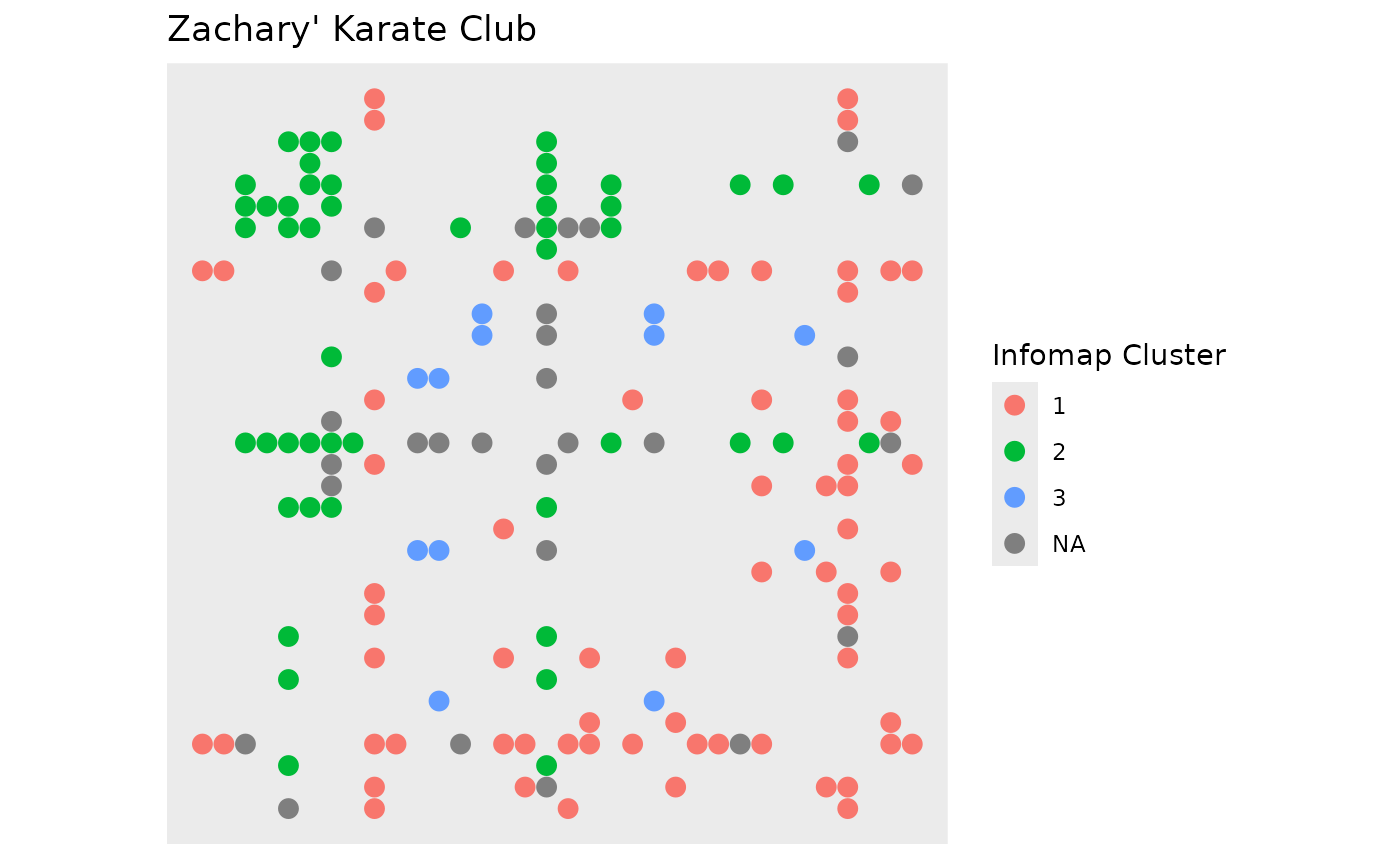
require(tidygraph)
gr <- create_notable('zachary') %>%
  mutate(group = group_infomap()) %>%
  morph(to_split, group) %>%
  activate(edges) %>%
  mutate(edge_group = as.character(.N()$group[1])) %>%
  unmorph()
#> Splitting by nodes

ggraph(gr, 'matrix', sort.by = node_rank_hclust()) +
  geom_edge_point(aes(colour = edge_group), mirror = TRUE, edge_size = 3) +
  scale_y_reverse() +
  coord_fixed() +
  labs(edge_colour = 'Infomap Cluster') +
  ggtitle("Zachary' Karate Club")