This geom is equivalent in functionality to ggforce::geom_voronoi_tile()
and allows for plotting of nodes as tiles from a voronoi tesselation. As with
ggforce::geom_voronoi_tile() it is possible to restrict the size of the
tile to a fixed radius, as well as round corners and expand/contract the
tile.
geom_node_voronoi(
  mapping = NULL,
  data = NULL,
  position = "identity",
  show.legend = NA,
  bound = NULL,
  eps = 1e-09,
  max.radius = NULL,
  normalize = FALSE,
  asp.ratio = 1,
  expand = 0,
  radius = 0,
  ...
)
Arguments
- mapping
Set of aesthetic mappings created by
ggplot2::aes()orggplot2::aes_(). By default x and y are mapped to x and y in the node data and group set to-1.- data
The data to be displayed in this layer. There are three options:
If
NULL, the default, the data is inherited from the plot data as specified in the call toggplot().A
data.frame, or other object, will override the plot data. All objects will be fortified to produce a data frame. Seefortify()for which variables will be created.A
functionwill be called with a single argument, the plot data. The return value must be adata.frame, and will be used as the layer data. Afunctioncan be created from aformula(e.g.~ head(.x, 10)).- position
A position adjustment to use on the data for this layer. This can be used in various ways, including to prevent overplotting and improving the display. The
positionargument accepts the following:The result of calling a position function, such as
position_jitter(). This method allows for passing extra arguments to the position.A string naming the position adjustment. To give the position as a string, strip the function name of the
position_prefix. For example, to useposition_jitter(), give the position as"jitter".For more information and other ways to specify the position, see the layer position documentation.
- show.legend
logical. Should this layer be included in the legends?
NA, the default, includes if any aesthetics are mapped.FALSEnever includes, andTRUEalways includes. It can also be a named logical vector to finely select the aesthetics to display.- bound
The bounding rectangle for the tesselation or a custom polygon to clip the tesselation to. Defaults to
NULLwhich creates a rectangle expanded 10\ vector giving the bounds in the following order: xmin, xmax, ymin, ymax. If supplied as a polygon it should either be a 2-column matrix or a data.frame containing anxandycolumn.- eps
A value of epsilon used in testing whether a quantity is zero, mainly in the context of whether points are collinear. If anomalous errors arise, it is possible that these may averted by adjusting the value of eps upward or downward.
- max.radius
The maximum distance a tile can extend from the point of origin. Will in effect clip each tile to a circle centered at the point with the given radius. If
normalize = TRUEthe radius will be given relative to the normalized values- normalize
Should coordinates be normalized prior to calculations. If
xandyare in wildly different ranges it can lead to tesselation and triangulation that seems off when plotted withoutggplot2::coord_fixed(). Normalization of coordinates solves this. The coordinates are transformed back after calculations.- asp.ratio
If
normalize = TRUEthe x values will be multiplied by this amount after normalization.- expand
A numeric or unit vector of length one, specifying the expansion amount. Negative values will result in contraction instead. If the value is given as a numeric it will be understood as a proportion of the plot area width.
- radius
As
expandbut specifying the corner radius.- ...
Other arguments passed on to
layer()'sparamsargument. These arguments broadly fall into one of 4 categories below. Notably, further arguments to thepositionargument, or aesthetics that are required can not be passed through.... Unknown arguments that are not part of the 4 categories below are ignored.Static aesthetics that are not mapped to a scale, but are at a fixed value and apply to the layer as a whole. For example,
colour = "red"orlinewidth = 3. The geom's documentation has an Aesthetics section that lists the available options. The 'required' aesthetics cannot be passed on to theparams. Please note that while passing unmapped aesthetics as vectors is technically possible, the order and required length is not guaranteed to be parallel to the input data.When constructing a layer using a
stat_*()function, the...argument can be used to pass on parameters to thegeompart of the layer. An example of this isstat_density(geom = "area", outline.type = "both"). The geom's documentation lists which parameters it can accept.Inversely, when constructing a layer using a
geom_*()function, the...argument can be used to pass on parameters to thestatpart of the layer. An example of this isgeom_area(stat = "density", adjust = 0.5). The stat's documentation lists which parameters it can accept.The
key_glyphargument oflayer()may also be passed on through.... This can be one of the functions described as key glyphs, to change the display of the layer in the legend.
Aesthetics
geom_node_voronoi understand the following aesthetics. Bold aesthetics are
automatically set, but can be overwritten.
x
y
alpha
colour
fill
shape
size
stroke
filter
See also
Other geom_node_*:
geom_node_arc_bar(),
geom_node_circle(),
geom_node_point(),
geom_node_range(),
geom_node_sf(),
geom_node_text(),
geom_node_tile()
Examples
require(tidygraph)
gr <- create_notable('meredith') %>%
mutate(group = sample(letters[1:4], n(), TRUE))
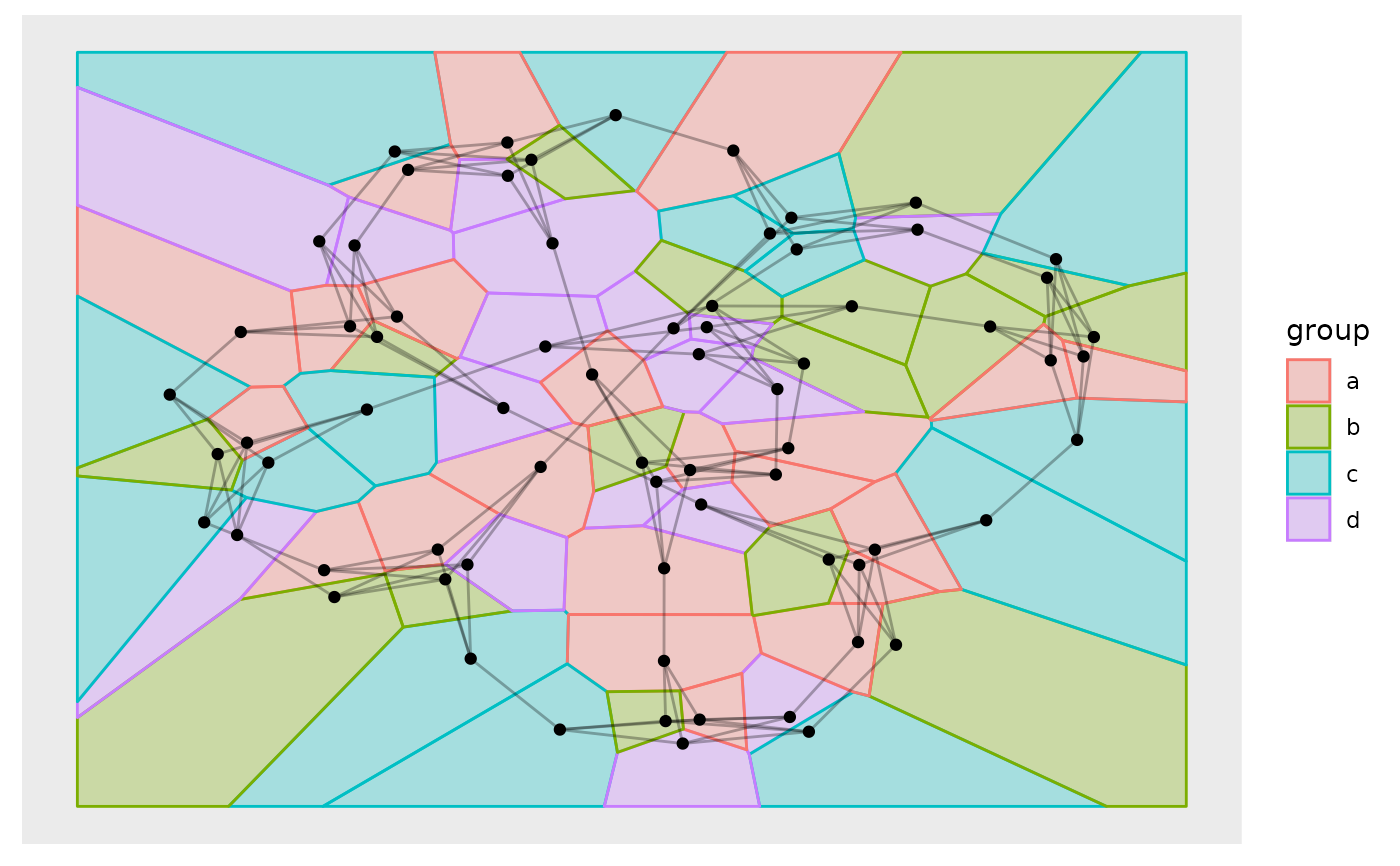
ggraph(gr) +
geom_node_voronoi(aes(fill = group, colour = group), alpha = 0.3) +
geom_edge_link(alpha = 0.3) +
geom_node_point()
#> Using "stress" as default layout
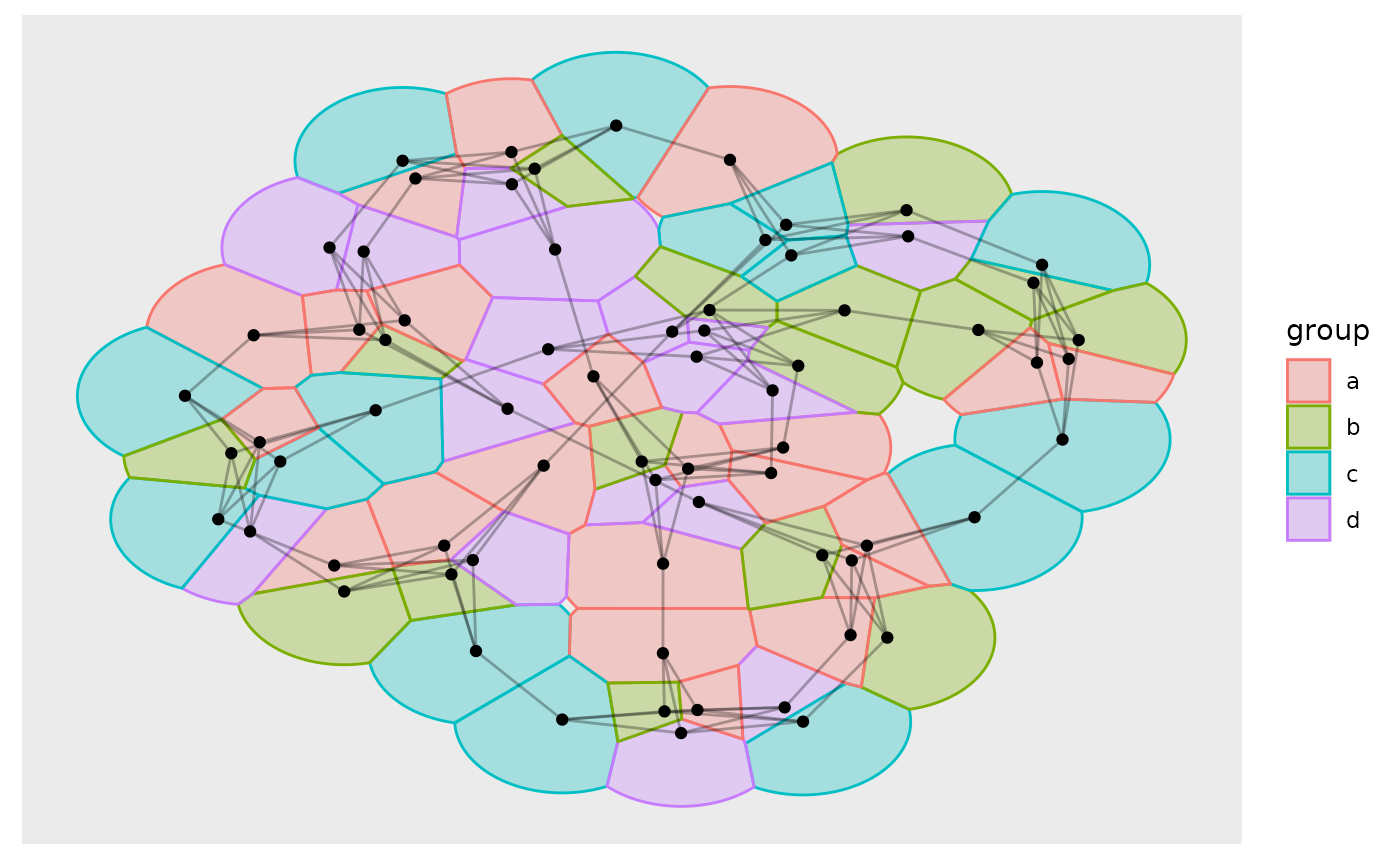
 # Use max.radius to make the tesselation more "node"-like
ggraph(gr) +
geom_node_voronoi(aes(fill = group, colour = group), alpha = 0.3, max.radius = 1) +
geom_edge_link(alpha = 0.3) +
geom_node_point()
#> Using "stress" as default layout
# Use max.radius to make the tesselation more "node"-like
ggraph(gr) +
geom_node_voronoi(aes(fill = group, colour = group), alpha = 0.3, max.radius = 1) +
geom_edge_link(alpha = 0.3) +
geom_node_point()
#> Using "stress" as default layout